
Your biggest quarter is coming
A second opinion on your Q4 split.
Every platform grades its own homework and claims credit for the same sales. You can run on those numbers in March. Running your biggest quarter of the year on them is a different kind of expensive. Send one brand's spend and revenue exports. Get back a recommended budget split, backed by an independent ROAS for every paid channel, in about a week. You keep the decision.
The 90-second overview
What you get back
The pages your next planning meeting needs.
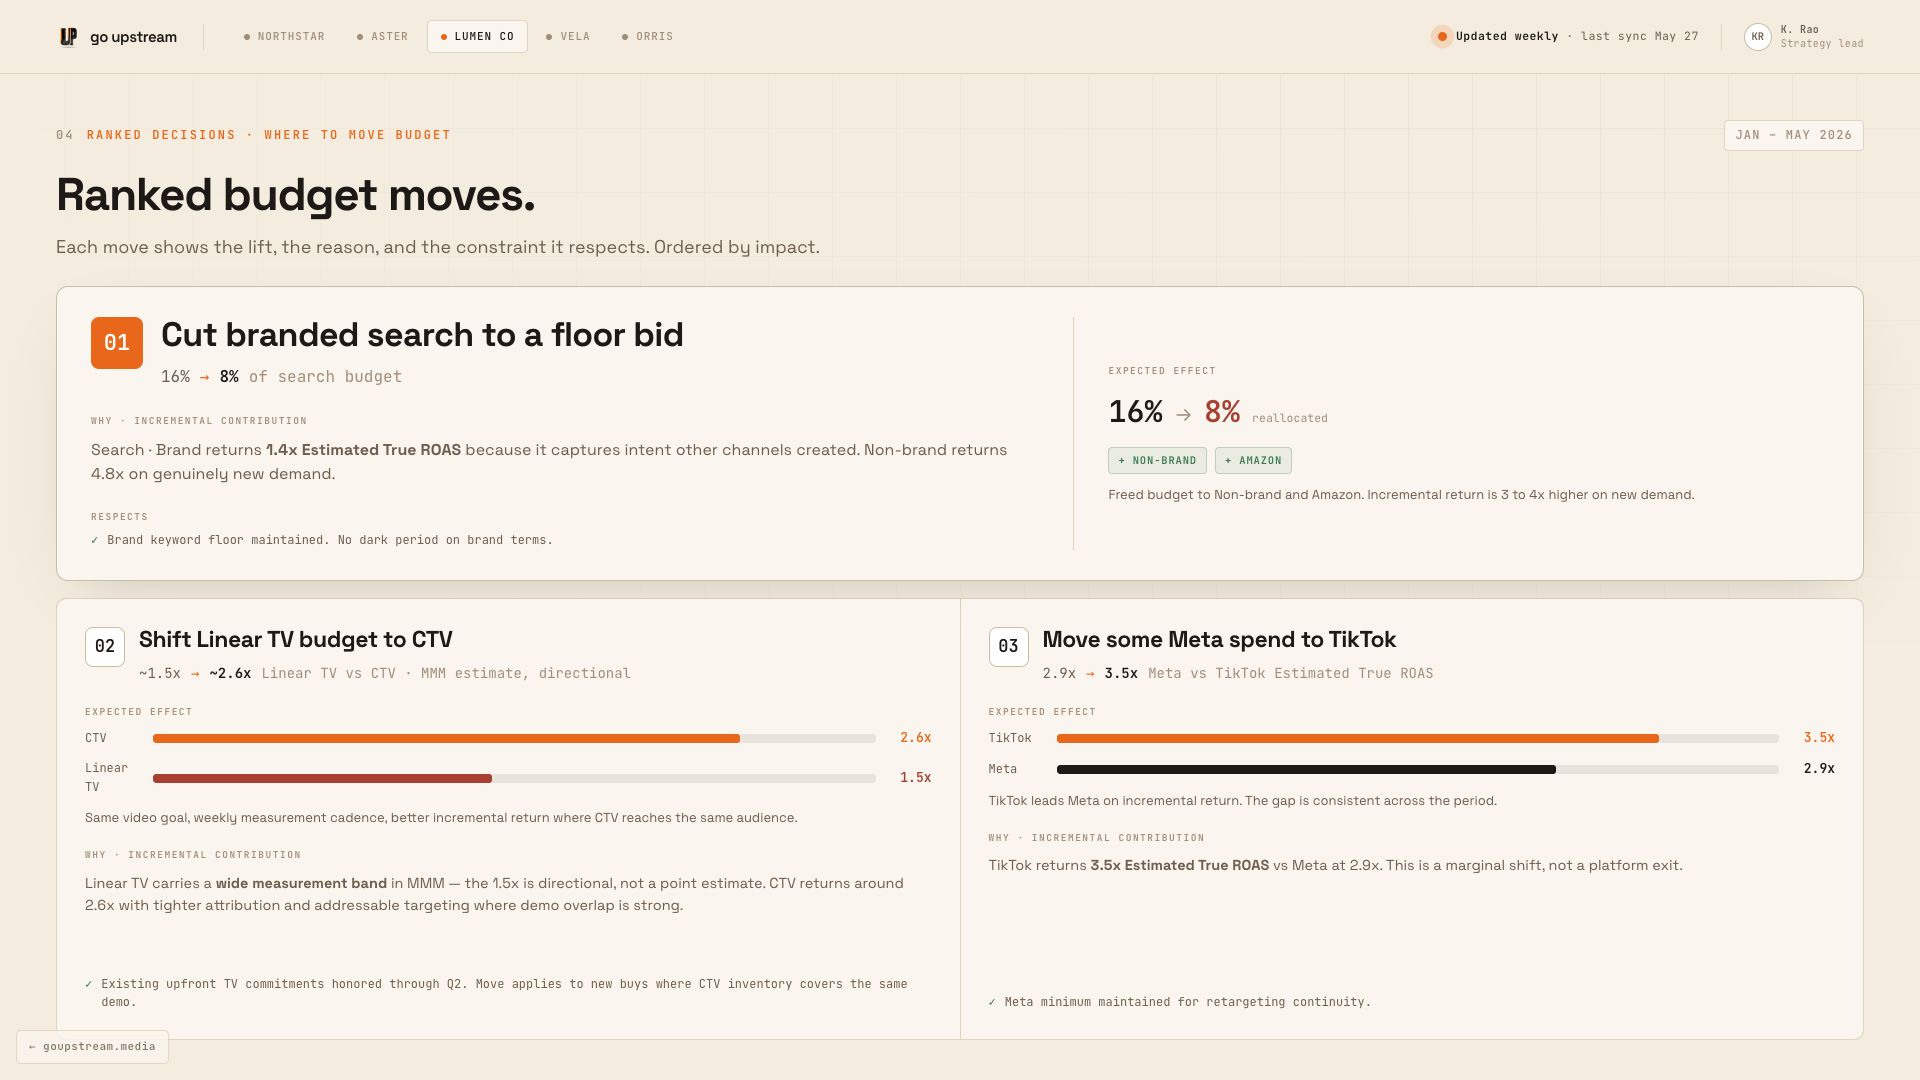
Ranked adjustments to your allocation, each with the projected impact, the reason, and the constraint it respects.
Mock data, real methodologyOpen the interactive report →
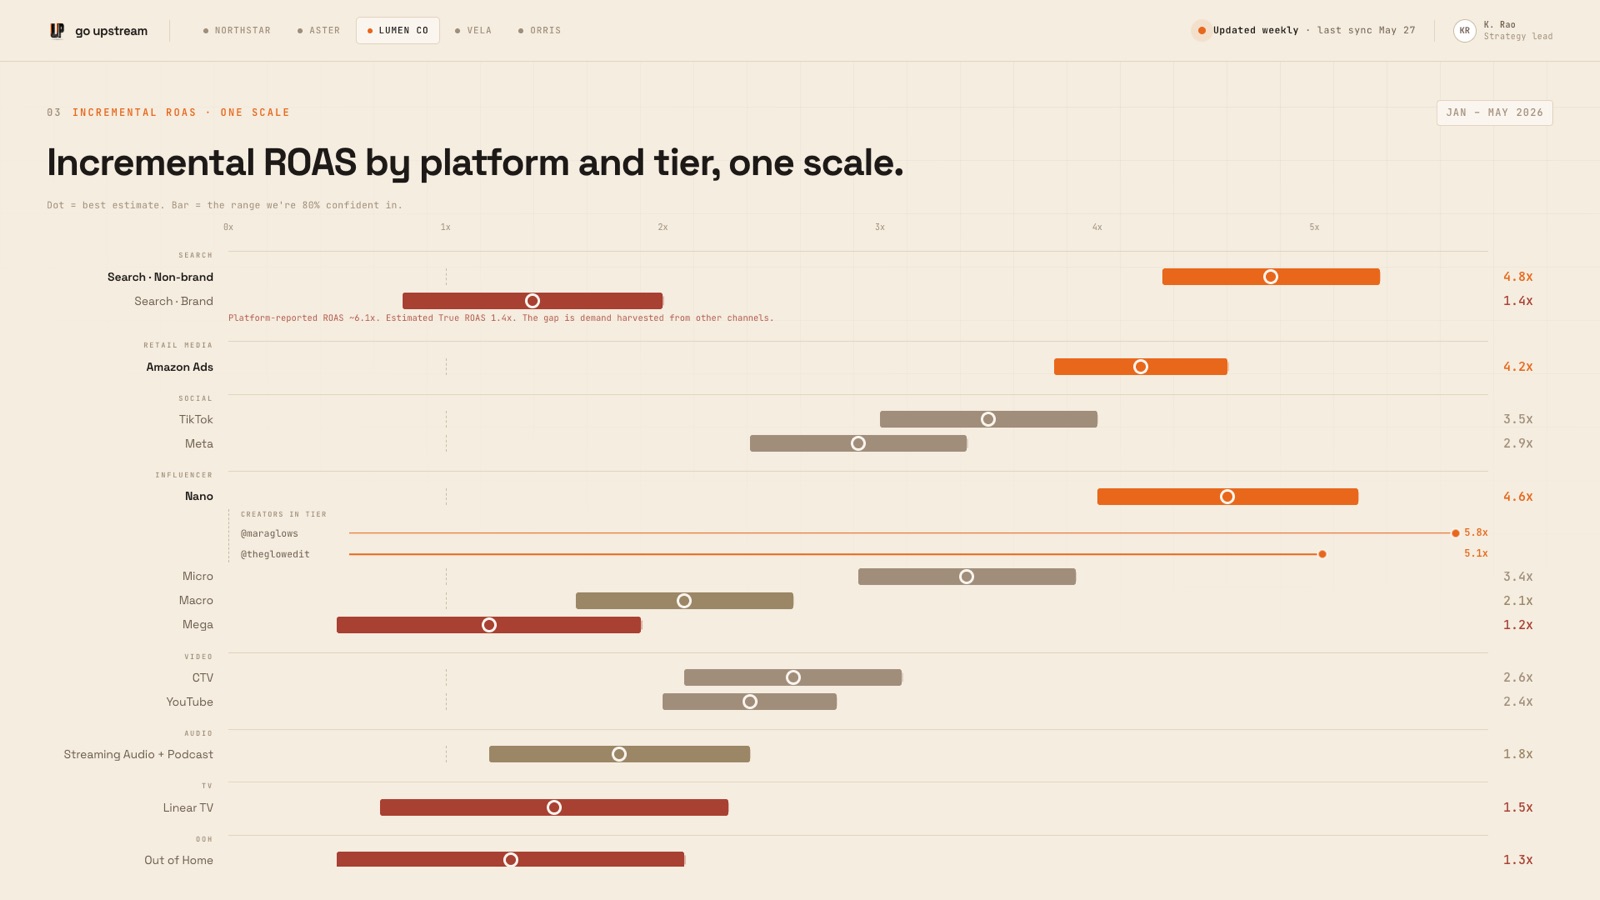
Every channel on one independent ROAS scale, with confidence bands. A scale your team or your client can read at a glance.
Mock data, real methodologyOpen the interactive report →
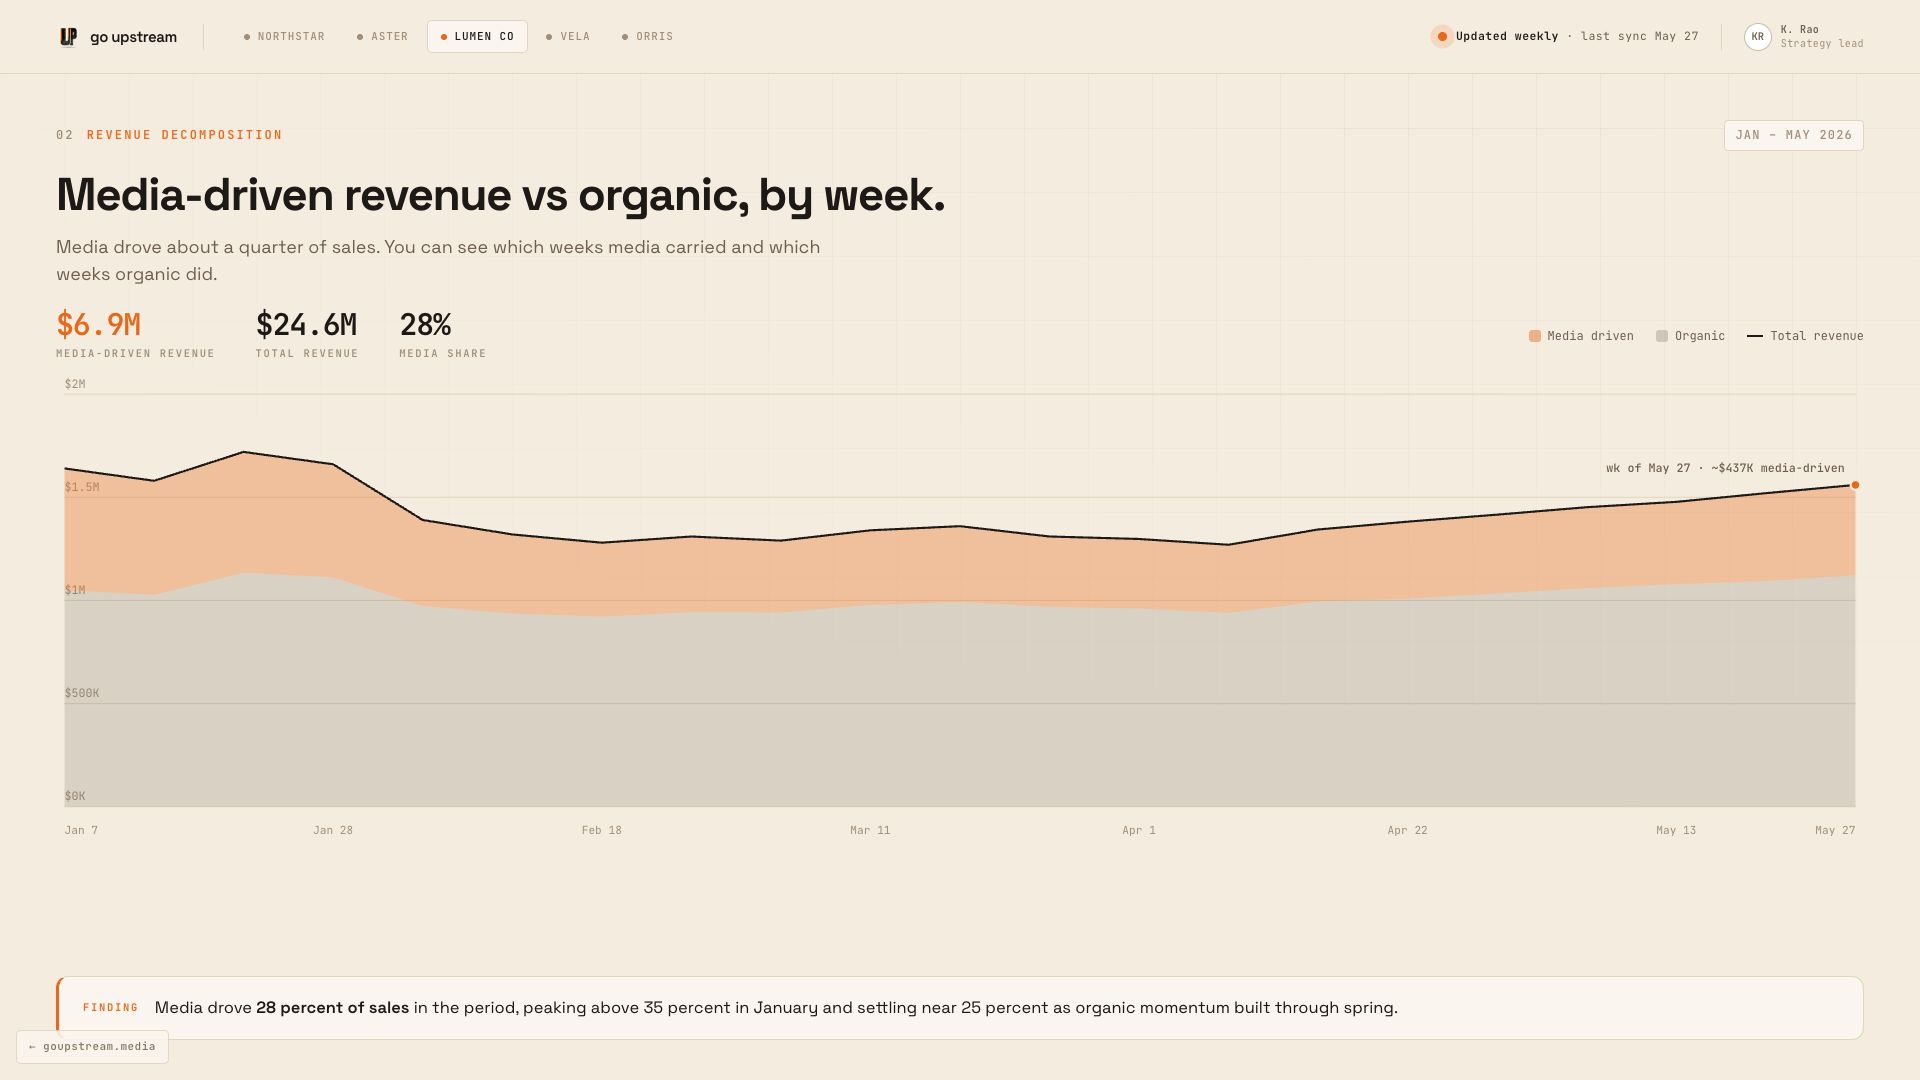
What media contributed, week by week, separated from organic.
Mock data, real methodologyOpen the interactive report →
How it works
01
Send one brand's exports.
Spend by channel, platform-reported performance, revenue. Six or more months if you have it.
02
We run the models.
One independent, comparable ROAS per channel, with ranked adjustments to your allocation and the reason behind each. Back within about a week.
03
You decide before Q4 ramps.
We walk your team through the findings first. You take the numbers into the planning meeting or the client QBR.
Everything is deleted on request. The exact input spec →
Why trust the number
We validated the model in a synthetic market with a known ROAS per channel, a benchmark real campaigns can't provide. It recovers 70 percent of the underlying market dynamics. A high-quality marketing model typically recovers 50 to 60. Standard approaches, around 15.
How the market is moving
7.7%
Budgets are flat, so the pressure to do more with less is real.Marketing budgets are holding at 7.7 percent of company revenue, with paid media the biggest line at 30.6 percent. The lever left is reallocating what you already spend.
Gartner 2025 CMO Spend Survey · 402 CMOs ↗
18%
Most teams are deciding on numbers they don't fully trust.Only 18 percent of app marketing leaders say they trust their attribution data.
Branch / GlobalSurveyz 2025 · 700+ director-level and above ↗
$17.7B
Your fastest-growing channel has no click to attribute.2026 is the first year streaming outsells primetime linear in the upfronts. CTV is taking a bigger share of the mix than click-based measurement can see.
eMarketer · 2026 upfront forecast ↗
Know what's working before Q4 ramps.
Start with the short form; we scope by email, no call needed. Data in by early September gives you the read before Q4 spend ramps. If your team runs on Claude or ChatGPT, the same analysis plugs in as an MCP server. Just ask.